The Power of Data Storytelling: Transforming Insights into Impact
In an era where data is the foundation of decision-making, the ability to effectively communicate insights is more crucial than ever. This is where data storytelling comes into play—a strategic approach that transforms raw data into compelling narratives that inform, engage, and inspire action.
Data storytelling is not just about presenting statistics; it is about weaving together analytical rigor, narrative techniques, and visual elements to create meaningful stories that resonate with audiences. When done effectively, data storytelling makes complex information accessible, enhances decision-making, and drives real-world impact.
Why Data Storytelling Matters
Data storytelling is the culmination of various data processes, including:
- Data Collection – Gathering relevant information from various sources.
- Data Preparation – Cleaning, structuring, and organizing data for analysis.
- Data Visualization – Using charts, graphs, and other visuals to represent data.
- Data Analysis – Interpreting patterns, trends, and correlations.
- Data Storytelling – Combining all elements into a compelling narrative.
While each step plays a vital role, storytelling is what gives data meaning and makes insights actionable. Here’s why mastering data storytelling is essential:
1. Enhances the Value of Data and Analysis
Numbers alone may lack context. By embedding data within a narrative, you create a richer, more impactful interpretation of your insights. Data storytelling helps uncover the “why” behind the numbers, making it easier to extract meaning and drive informed decision-making.
2. Simplifies Complex Information
Not everyone is comfortable interpreting raw data. Storytelling bridges the gap by translating complex insights into digestible, engaging narratives. This ensures that even those without advanced analytical skills can understand and act upon the information presented.
3. Highlights Key Takeaways for Better Decision-Making
In a world overflowing with information, it’s easy for critical insights to get lost. Data storytelling emphasizes the most important aspects of your analysis, ensuring that audiences focus on key trends, patterns, and takeaways without being overwhelmed.
4. Establishes Credibility and Thought Leadership
Effective data storytelling positions you as a thought leader in your industry. By demonstrating an ability to analyze, interpret, and communicate data-driven insights compellingly, you build trust and establish yourself as a credible source of information.
5. Strengthens Communication with Clients and Stakeholders
Clear and engaging communication is vital in any business setting. Data storytelling enhances interactions with clients, investors, and partners by making reports and presentations more persuasive, insightful, and easier to understand.
Key Ingredients of Effective Data Storytelling
To harness the full power of data storytelling, three essential components must be integrated: Narrative, Visuals and Data.
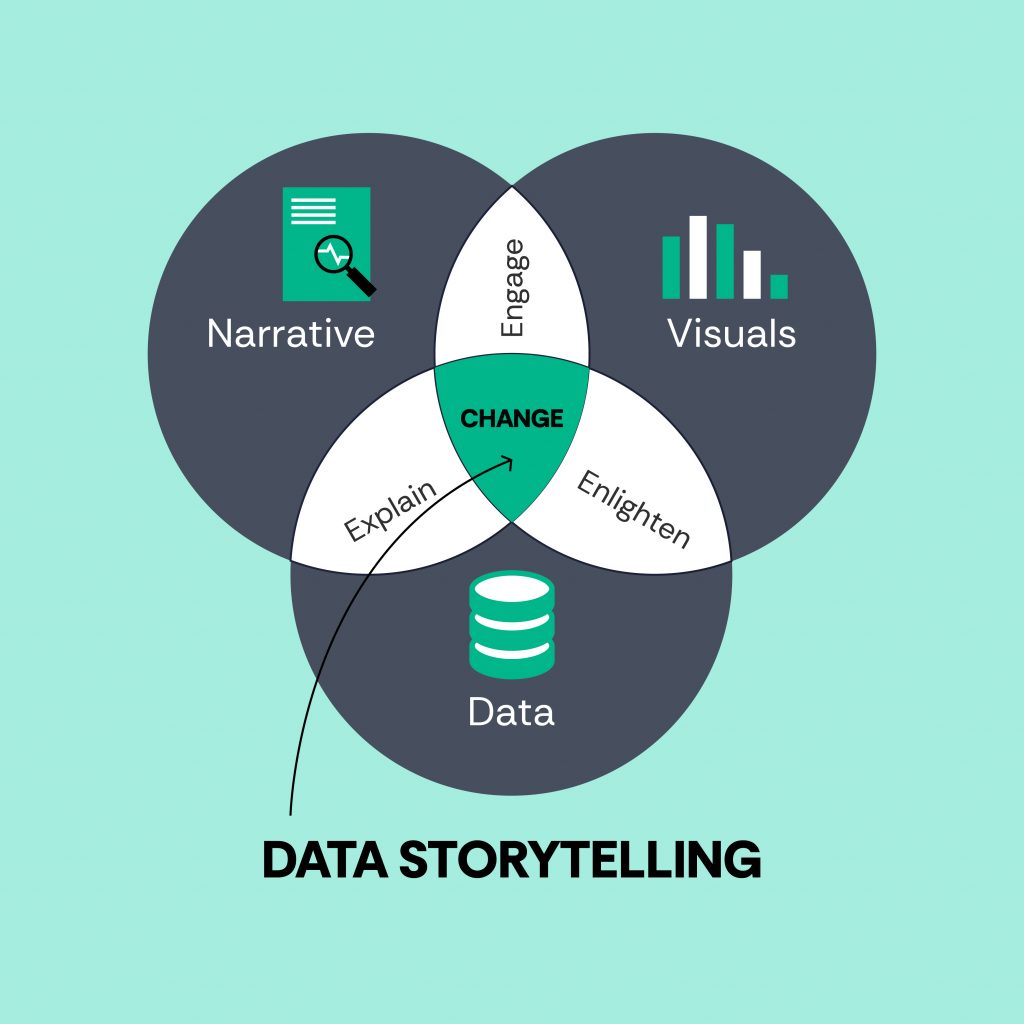
Visuals: Bringing Data to Life
Visualization plays a crucial role in storytelling. Charts, graphs, and infographics help audiences quickly grasp the significance of data. Well-designed visuals simplify complex data points and make trends easier to identify, ensuring that key messages are communicated effectively.
Data: The Foundation of Every Story
Data is the backbone of storytelling, providing the evidence and insights needed to support your narrative. Ensuring data accuracy and relevance is critical, as misleading or incorrect information can weaken your credibility and diminish trust in your message.
Narrative: The Connecting Thread
A compelling story weaves data and visuals into a structured, engaging format. A strong narrative ensures that your audience stays engaged, understands the significance of the data, and is motivated to take action. Without a narrative, data remains just numbers on a page.
How Is Data Storytelling Different From Data Visualization?
While both data storytelling and data visualization play essential roles in communicating insights, they serve different purposes and require distinct approaches.
Data Visualization: A Tool for Representation
Data visualization involves the use of visual elements—such as bar charts, pie charts, heat maps, and line graphs—to represent data in a structured and visually appealing manner. Its primary function is to display trends, relationships, and patterns in data to facilitate quicker understanding. A well-designed visualization helps make raw data more accessible but does not necessarily provide context or narrative on its own.
Data Storytelling: A Tool for Interpretation and Engagement
Data storytelling, on the other hand, goes beyond visualization by embedding data within a narrative framework. It connects individual data points into a coherent, engaging story that provides meaning, context, and interpretation. A strong data story not only highlights insights but also guides audiences through an engaging journey, making information more memorable and actionable.
While data visualization is a fundamental component of data storytelling, the latter takes insights a step further by ensuring that data is not just seen but also understood, interpreted, and acted upon.
Effective data storytelling has the power to transform the way you communicate insights, influence decision-making, and drive engagement. At 365CREA, we specialize in crafting compelling data narratives that make an impact. Whether you’re looking to improve presentations, enhance reports, or develop data-driven content strategies, our experts can help you bring your data to life.
12 comments
achat kamagra sans ordonnance comprime l alcool
August 17, 2025 at 8:27 amachat kamagra en paris
kamagra commande en ligne pas d’adhésion du jour au lendemain
order enclomiphene canada how to buy
August 17, 2025 at 9:13 amenclomiphene in canada
low testosterone and enclomiphene
cheap androxal buy in london
August 17, 2025 at 10:19 ambuying androxal generic name
ordering androxal online without a prescription
buying flexeril cyclobenzaprine cheap trusted
August 17, 2025 at 1:13 pmbuying flexeril cyclobenzaprine usa where to buy
how to buy flexeril cyclobenzaprine cost usa
Order gabapentin online by fedex
August 17, 2025 at 2:15 pmonline order gabapentin generic canadian
online order gabapentin online no rx
fildena online canada
August 17, 2025 at 3:46 pmdiscount fildena purchase in the uk
buying fildena canada price
buy staxyn in canada
August 18, 2025 at 2:15 amorder staxyn generic online mastercard
purchase staxyn no prescription overnight delivery
discount itraconazole usa seller
August 18, 2025 at 2:44 amcheap itraconazole generic order
get itraconazole cost at costco
buying avodart generic next day delivery
August 18, 2025 at 3:59 amcheapest buy avodart cheap uk
cheapest buy avodart cheap wholesale
can you buy rifaximin in mexico
August 18, 2025 at 5:50 amcheap rifaximin generic no prescription
online order rifaximin australia suppliers
online order xifaxan new zealand buy online
August 18, 2025 at 5:58 amdiscount xifaxan cost insurance
xifaxan lowest price
erektilní dysfunkce kamagra
August 18, 2025 at 8:55 amkamagra bez lékařského předpisu
nejlevnější není nutný předpis kamagra
Comments are closed.