Enhancing UX with Visual Storytelling: A Deep Dive into Charts and Graphs
In a world overflowing with data, the ability to simplify and communicate information is a superpower. For UX designers, charts and graphs are the tools of choice to achieve this, turning numbers into narratives and complexity into clarity.
This article explores the most essential types of charts and graphs in UX design, complete with real-world examples and expert tips to help you choose the right visualization for your project.
The Role of Data Visuals in UX
Data visuals are more than static images—they’re dynamic storytelling devices. They empower users to explore patterns, make informed decisions, and engage with content on a deeper level. By integrating visuals like bar charts, flow charts, and scatter plots, UX designers can create interfaces that are not only functional but also memorable.
Breaking Down the Chart Types
1. Flow Chart:
Purpose: Guides users through processes or decision points.
Example: Visualizing a troubleshooting guide in a tech support app.

Flow Chart
2. Bar Chart:
- Purpose: Highlights comparisons.
- Example: Comparing product performance across different demographics.

Bar Chart
3. Pie and Donut Charts:
- Purpose: Show proportions.
- Example: Visualizing budget allocation in a project management app.
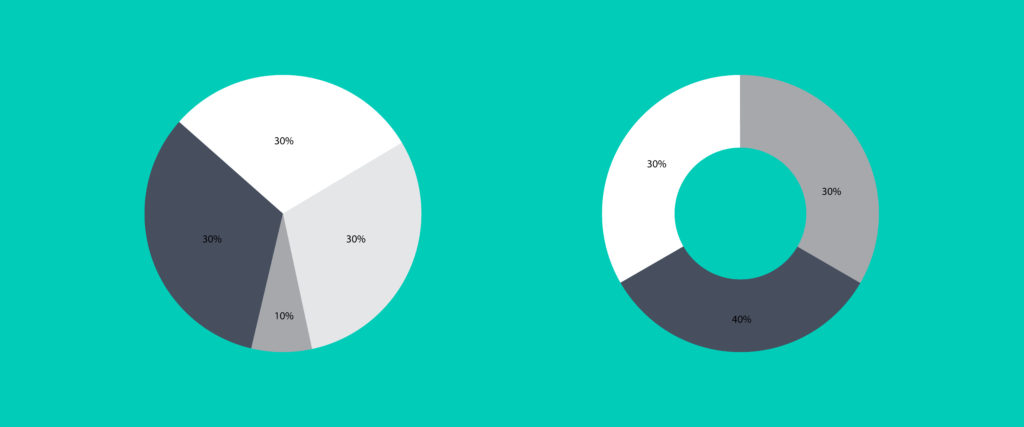
Pie and Donut Charts
4. Line and Area Charts:
- Purpose: Display trends over time.
- Example: Monitoring engagement metrics in a marketing campaign.
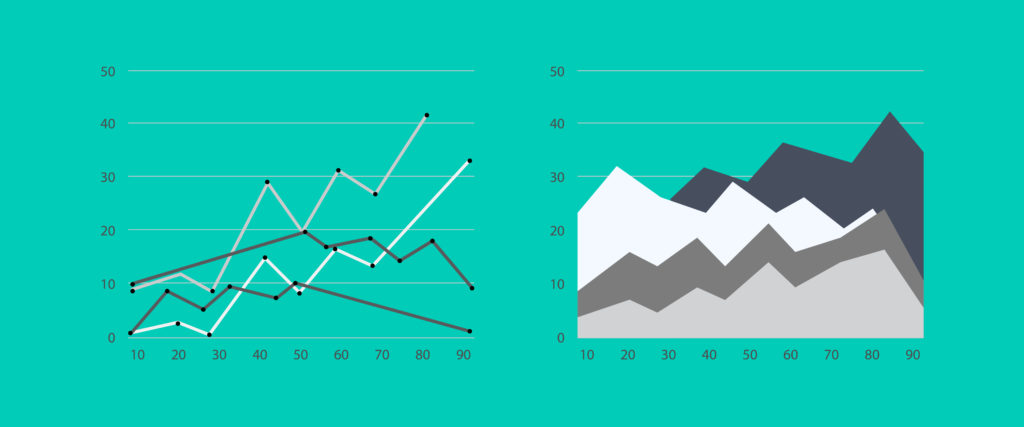
Line and Area Charts
5. Scatter Plot and Spider Chart:
- Purpose: Explore relationships and compare multiple metrics.
- Example: Evaluating app usability across various user personas.

Scatter Plot and Spider Chart
Case Study: Elevating Data Visuals in UX
Discuss a hypothetical or real case study where selecting the right chart type improved user experience. For example:
Scenario: A fitness app struggling to engage users.
Solution: Implemented a combination of line and spider charts to personalize progress tracking and highlight key fitness metrics.
Outcome: Increased user retention by 25%.
Practical Tips for Designing Effective Charts
- Focus on a clean layout to enhance readability.
- Use interactive elements for deeper engagement.
- Ensure responsive design for mobile compatibility.
As a UX designer, your goal isn’t just to design—it’s to communicate. By leveraging the power of charts and graphs, you can turn raw data into experiences that inform and inspire.
Looking to amplify your UX projects with impactful visual designs? Let’s collaborate with 365CREA.
13 comments
get androxal cheap with prescription
August 16, 2025 at 5:12 pmbuying androxal without a rx
can i get androxal at at wal-mart store without a prescrition
cheapest buy enclomiphene usa buy online
August 16, 2025 at 5:17 pmenclomiphene on line no perscription
cheapest buy enclomiphene generic good
where can you get rifaximin with out a perskripion
August 17, 2025 at 2:10 amget rifaximin generic from india
Buy rifaximin next day overnight fedex delivery order rifaximin cod
get xifaxan cheap usa
August 17, 2025 at 2:18 amcash for xifaxan
xifaxan walmart price
discount staxyn cheap store
August 17, 2025 at 3:45 amonline purchase staxyn
buy staxyn generic from canadian pharmacy
how to order avodart canada purchase
August 17, 2025 at 3:45 amavodart weight loss
cheapest buy avodart cheap europe
ordering dutasteride generic mastercard
August 17, 2025 at 5:05 ambuying dutasteride generic uk next day delivery
buying dutasteride generic next day delivery
buy cheap flexeril cyclobenzaprine generic from canadian pharmacy
August 17, 2025 at 5:05 amhow to buy flexeril cyclobenzaprine generic usa
order flexeril cyclobenzaprine canada price
how to buy gabapentin cheap store
August 17, 2025 at 5:59 amhow to order gabapentin generic south africa
buy gabapentin france where to buy
get fildena generic prices
August 17, 2025 at 6:11 amhow to order fildena generic new zealand
cheapest buy fildena australia discount
comprar kamagra en bilbao
August 17, 2025 at 7:02 amva schválený lék kamagra
získejte vzorek zdarma kamagra
kamagra sans rx
August 17, 2025 at 7:35 amsans ordonnance kamagra francaise
donde comprar kamagra en mar del plata
itraconazole overnight no script mastercard accepted
August 18, 2025 at 2:54 amdiscount itraconazole generic pharmacy usa
discount itraconazole cheap from usa
Comments are closed.